Dan Druce · Portfolio
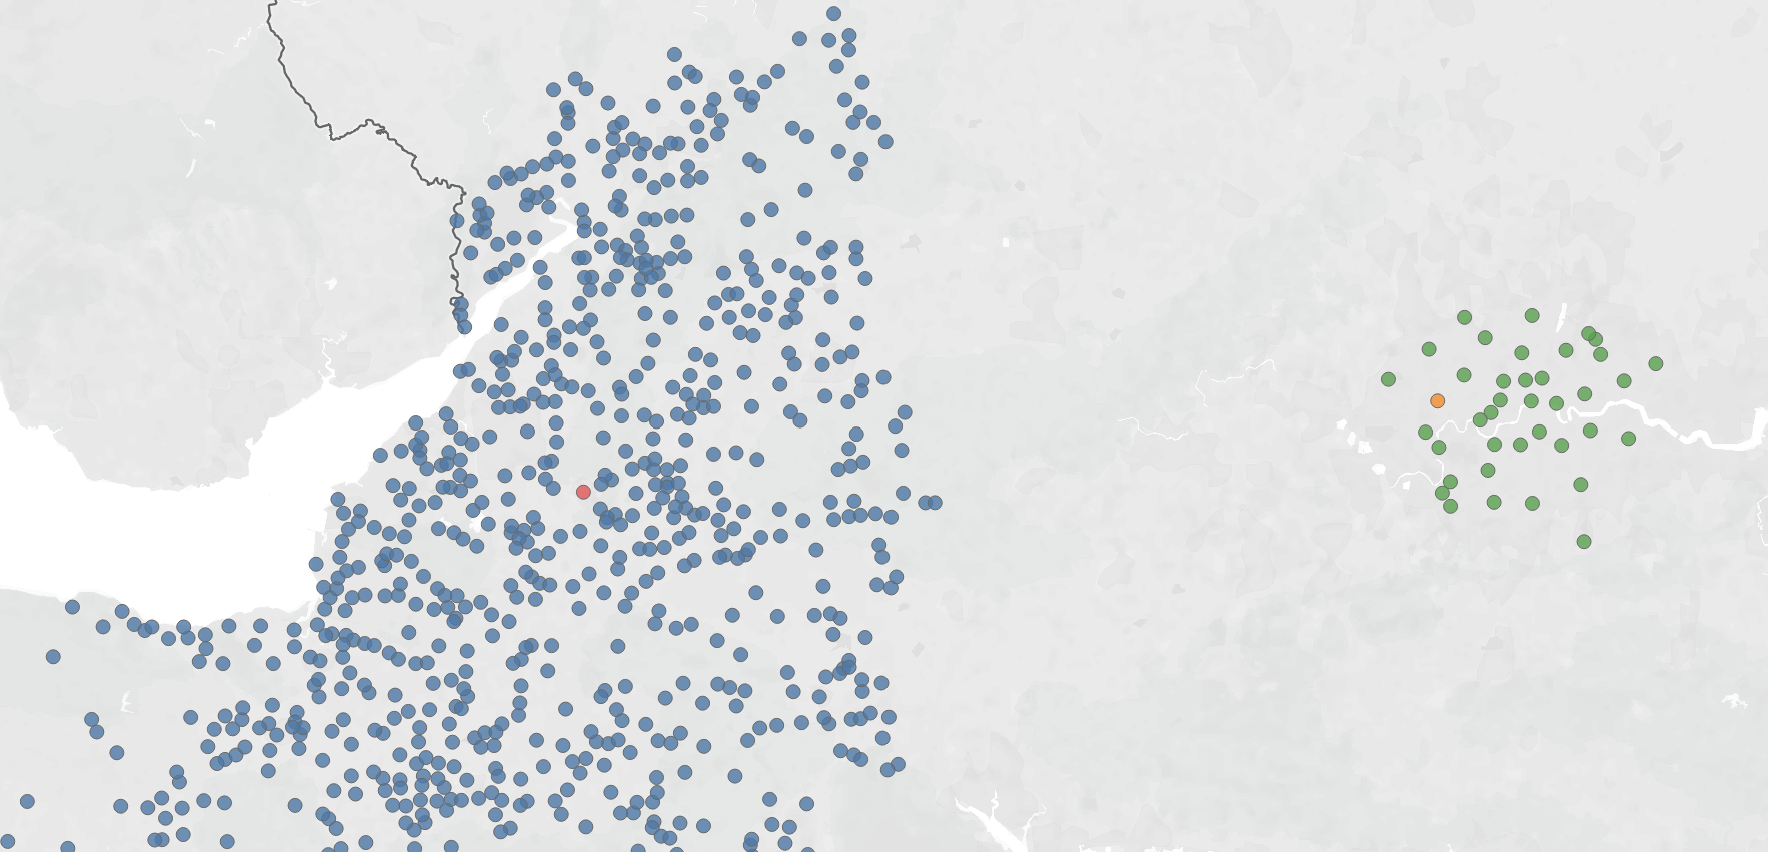
1. The Dashboard
Below is an embedded version of the dashboard. You can also access the dashboard here.
2. Project Overview
2.1 Objective for Countrywide Dashboard
To analyses comprehensively the cost of houses over time by creating a tool that can asses:
- General trends in house prices over time by region including:
- House price to pay ratios to determine if house prices are over-inflated vs average salaries at this point in time.
- House price to rent ratios to determine if it is actually better to rent or buy at this point in time.
- Impact of “Tenure”, “Property Type” and being a “New Build” has on house price between two locations in the UK
- Is it a good time to buy or rent?
- Is it a bad time to sell in Ealing London?
- Will Bath be more expensive than Ealing to purchase?
2.2 Tools & Methodology
- Excel was used for initial data exploration and light preparation of the smaller data files. It was also used to merge indices for rental data.
- SQL Server Management System (SSMS) was used to query data in SQL Server**.** This was used for data exploration, creating relationships between my data and preparing data for manipulation. It supported ongoing checks to validate results throughout the dashboarding process.
- Tableau was used to build comprehensive dashboards with distinct analytical focuses:
- A high level comparative overview of two towns/cites in England
- A high level overview of rent, house price and wage ratios in England
2.3 Table Structure for Housing Data
This project analyses the entirety of the Price Paid Data supplied by HM Land Registry. More details of this are in available in House Dashboard.
All links to data is available within the appendices. Here is a selection of my most used columns from the selected tables.
Relevant columns from selected tables
| Column Name | Description/Entry | Table |
|---|---|---|
| Year | Year(Int) | DimDate |
| Price | Price of sale | Fact_PPD [1] |
| Property Type | Semi Detached, Flat, Detached, Terraced | Fact_PPD [1] |
| Tenure | Freehold, Leasehold | Fact_PPD [1] |
| Old/New Build | New Build, Existing | Fact_PPD [1] |
| Longitude | Longitude ordinate of the postcode | DimGeog [2] |
| Latitude | Latitude ordinate of the postcode | DimGeog [2] |
| Town/City | Names of towns and cities mapped to Postcode using SAGA GIS and region polygons [9] | DimGeog [9] |
| Region | Regions in England | DimRegion [2] |
| Catagory Type | A (regular house sales) | Fact_PPD [1] |
| Median Wages | Median wages by year | Fact_Wages [7] |
| Median Rent | Median rent by year | Fact_Rent [3][4][5] |
The column referencing Town/City of the Fact_PPD was of poor quality and unusable. The DimGeog Town/City reference wasn’t specific enough for what I wanted either so I opted to map the postcodes from DimGeog onto the official polygon vector boundaries of the ONS Built Up Areas in SAGA GIS (using a Point-in-polygon spatial join). I used a filtered DimGeog to just England as the dataset was so vast. The completed spatial join was appended back into DimGeog to create an accurate Town/City column to the 2025 postcodes.
2.4 Rental Data
It is worth noting that rental data is not as detailed as housing data. The rental index time series [4] covered from Jan 2005 to Jan 2024. For data back to 1995 I needed to backdate my index using the yearly RPI rental index [3]. As the indices were different, I had to standardise. I chose to make the rental time index my standard [4]:
Standardised Index = Index2005 [4] × Indexn date [3] / Index2005 [3]
Because the standardised index before 2005 is using the England index data for all regions rather than regional indices it is worth noting observations including this period are less accurate.
Rental data had to be average rental, not an index. To do this I used a 2021 valuation for each region as I could find the average rent price of the same regions in 2021 [5]:
Standardised Regional Rent = Rent in 2021 × Indexn date / Index2021
Standardised Regional Rent Excel Formula
# Standardised Regional Rent (Excel)
=IFERROR(
			IF(A2=2021,
				VLOOKUP('StandardisedIndex'!B1197,Vlookups!$F$2:$H$11,2,FALSE),
				(VLOOKUP(B2,Vlookups!$F$2:$G$11,2,FALSE))*(C2/VLOOKUP(B2,Vlookups!$F$2:$H$11,
						3,FALSE)))
	,"")

	# In hindsight I could have used named ranges for user readability,
	# I didn't update due to time restraints
2.5 Countrywide Dashboard Specific Notes
- There were too many rows for the countrywide dashboard. I calculated Year x Town/City x Tenure x Property Type x New Build came to around 4 million rows.
- I therefore pre-aggregate the data in SQL and calculated medians using windows functions. Some towns had a large variation in the number of a certain field, for example 50 freehold to 2 leasehold. For this dashboard I created a weighted average to offset this when combining the fields.
Tableau Calculated Fields
# House Price to Pay  (Countrywide Dashboard)
SUM([Median House Price])/Sum([Median Pay])

# Weighted Average of Medians (Countrywide Dashboard)
SUM([Med Price]*[Number Of Sales])/SUM([Number Of Sales])

# Group Comparison (Countrywide Dashboard)
IF [RegionName] = [RegionAParameter]
AND ([TownAParameter] = "All" OR [TownAParameter] = [Town/City])
THEN "Region A"

ELSEIF [RegionName] = [RegionBParameter]
AND ([TownAParameter] = "All" OR [Town/City] = [TownAParameter])
THEN "Region B"

ELSE
    "UK Avg"
END
3. Key Findings
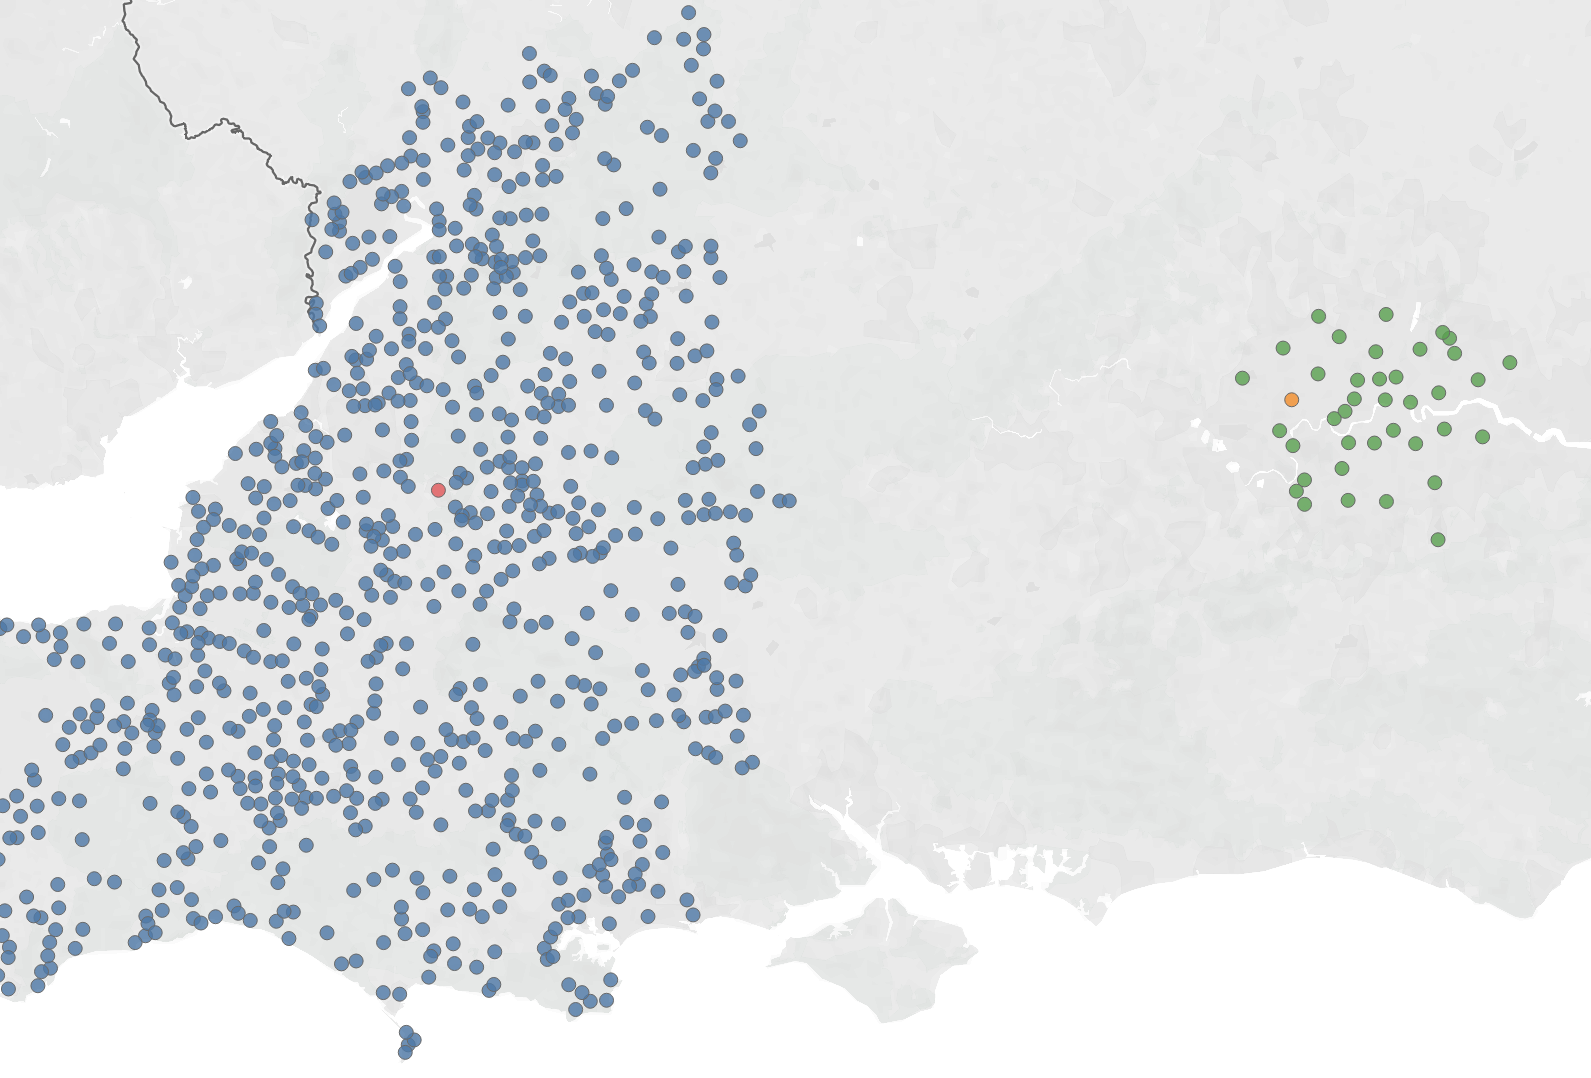
Where relevant, I have focussed mostly on the South West and London as these contain the borough of Ealing and City of Bath.
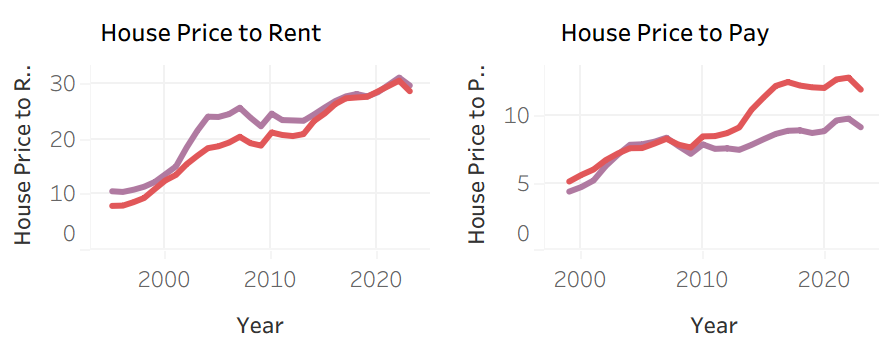
3.1 House Prices are Currently High in England
Median house prices have increased greatly in terms of price over the past 30 years. They are currently close to the highest they’ve been in this period compared to both the median rent and median pay.
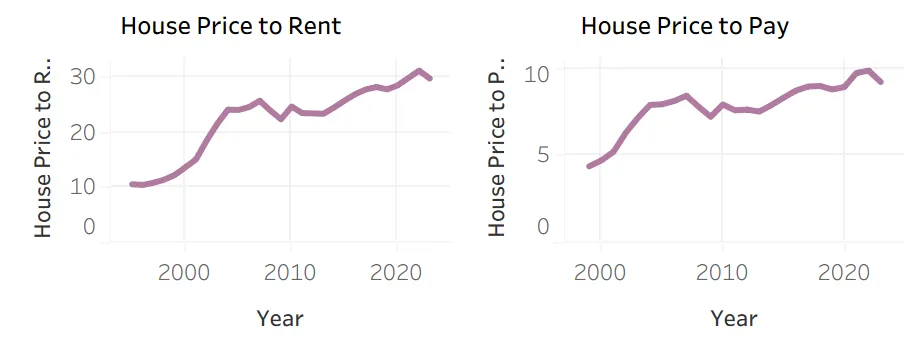
In the South West (purple), most of the rise was done from 1999 to 2007: house prices went from 12x annual rent to 26 x annual rent and from 4x annual pay to 8x annual pay (to the nearest integer). The rise since 2007 to 2023 has been much less 26x to 30x and 8x to 9x (to the nearest integer).
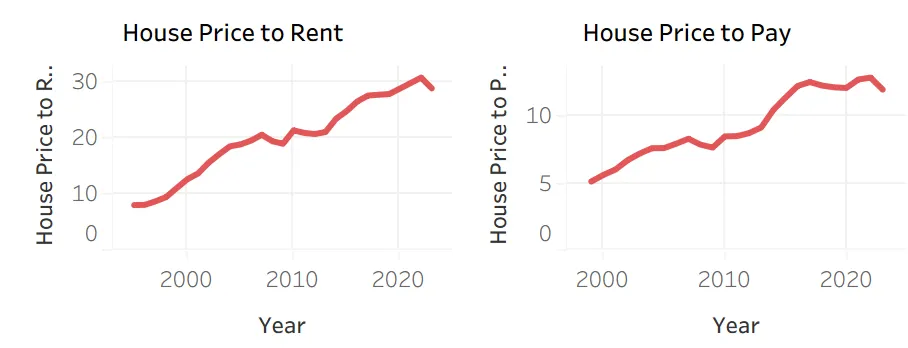
London (Red) shows steady growth in house price to rent from 11x to 21x annual rent and 5x to 8x the annual salary from the years 1999 to 2007. London house price to rent increases much more in the years that follow from 21x to 30x the annual rent. House price to pay is a different story, it appears to have plateaued from 2017 and is always between 12-13x the median yearly salary over this period (to the nearest integer).
There is now a disparity between price values in London and the South West. House price to pay has increased greatly in London since 2009 compared to the South West seen by the large gap between these two graphs. There was not much change in the Pay to Rent ratio in these regions so I have omitted a screenshot.
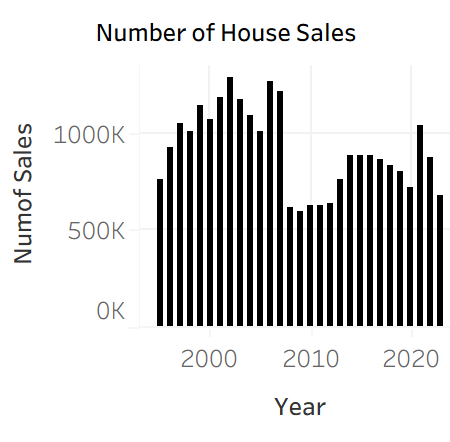
3.2 Countrywide House Sales Have Not Recovered Since 2008
House sales in both areas share a similar trend to the nationwide trend. Number of house sales dropped after 2008. Countrywide they halved in 2008 which coincides with the 2008 financial crisis. There is an increase in sales from 2014, and a further spike in 2021, likely from the stamp duty holiday that broached that year. Both of these increases are not as much as 2000-2008 averages.
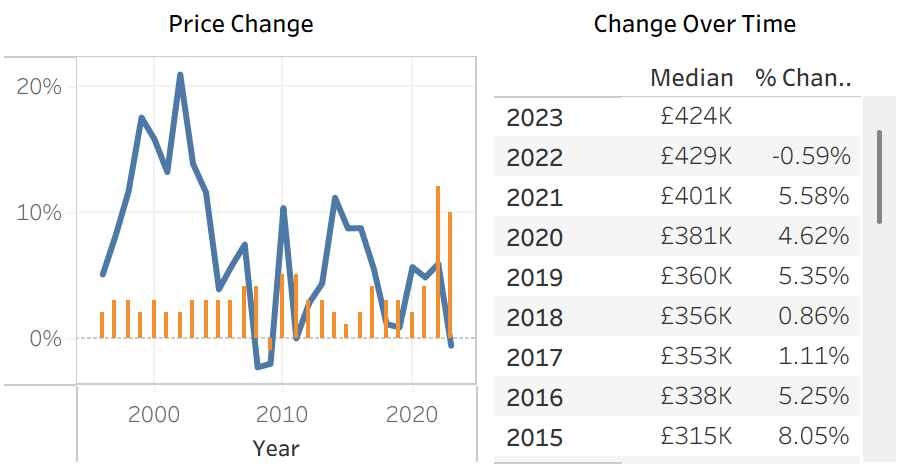
3.3 House Prices Have Recently Devalued in Real Terms by Inflation
Before 2008, the house price change was always greater then inflation. After this time the percentage change an inflation have shown inconsistency. Inflation from 2022 and 2023 was greater than the house price percentage change from 2021 to 2022 to 2023, therefore have decreased in real terms.
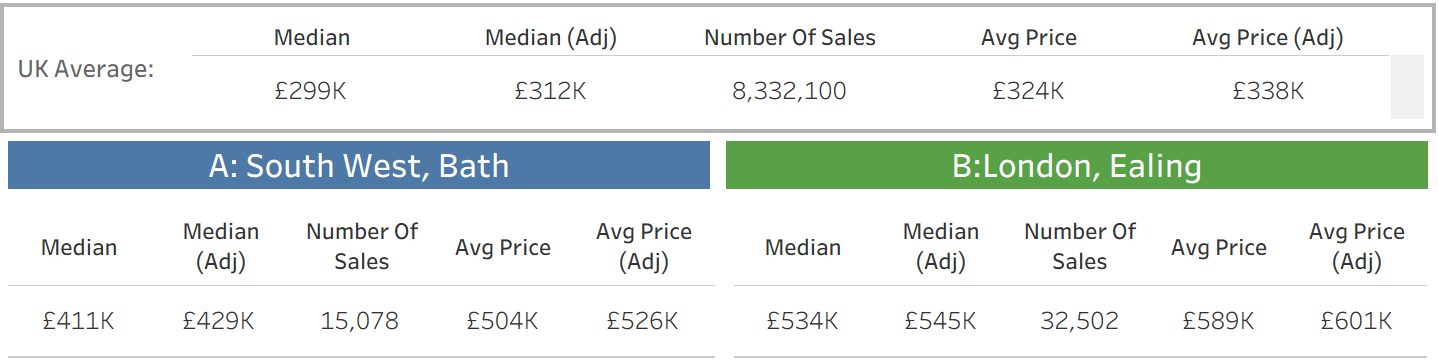
3.4 Bath and Ealing are Both Expensive Places to Live
Knowing of the impact of 2008 and house sale numbers appearing to increase 2014, I filtered my data from 2015 to 2025.
Ealing has a larger number of sales over the 10 year period, over double the number of Bath. Ealing's median house price adjusted for inflation is higher by £116. Interestingly, the average price adjusted is less, suggesting there are some very expensive houses in Bath skewing up the numerical average. Both areas are expensive places to live, being much higher than the UK average.
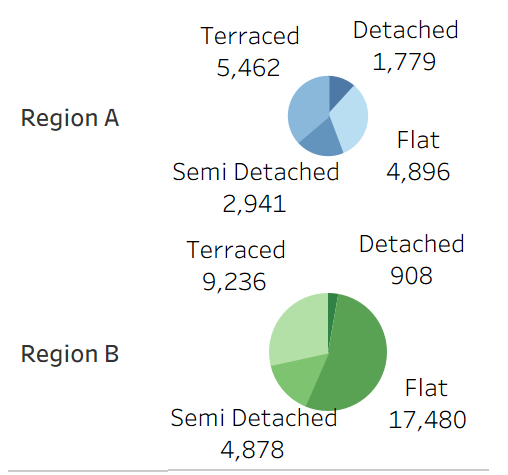
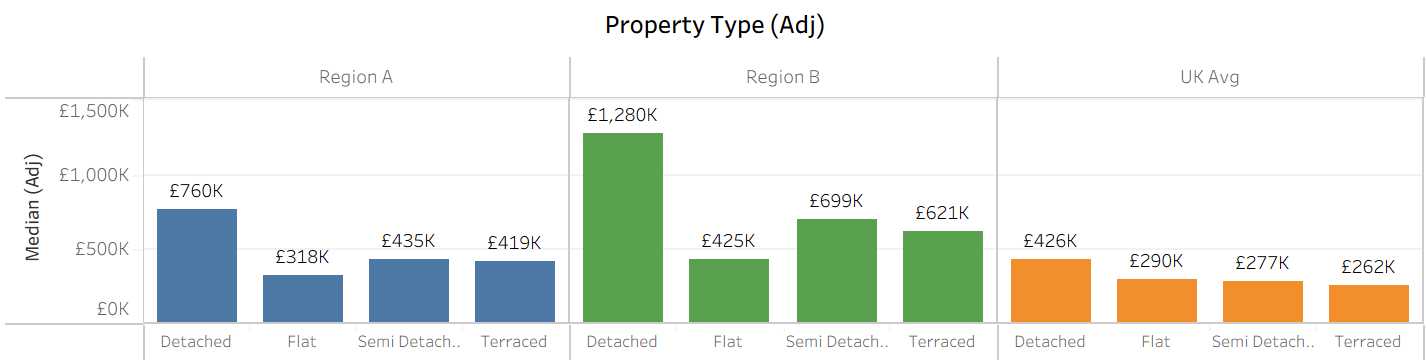
3.5 Property Types and Prices Differ Between Bath & Ealing
Ealing has a high proportion of house sales being flats compared to Bath, over 50%. It also has a very low proportion of its property sales being detached, only 908 of the 32,000 sales. Bath seems more a mixture but with terraced houses being very popular. This fits in with the stereotype of “Bath stone terraces”.
Even the lowest priced property type in Ealing, Flats, is much above the UK average price. Someone who can afford a flat in London can afford a flat or a terraced house in Bath, with house prices being in the hundreds of thousands, it is within reason to say they could afford a Bath semi detached house.
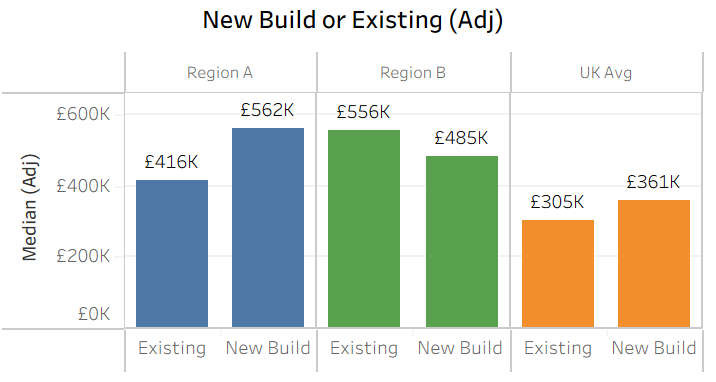
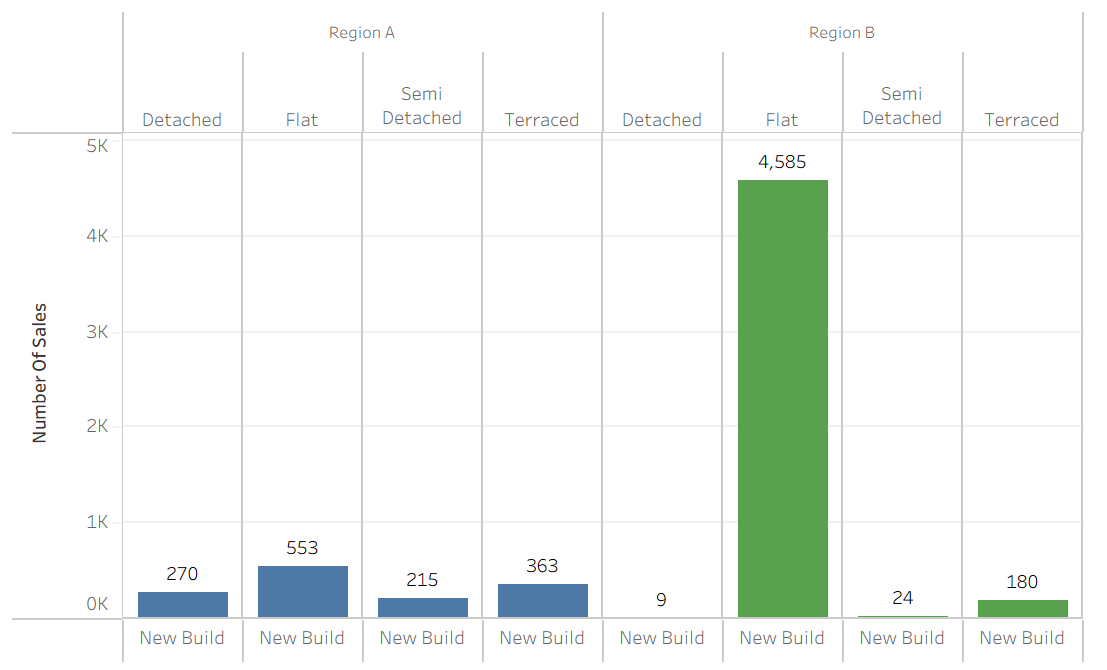
3.6 New Builds are Cheaper in Ealing than Existing Property
From 2015 to 2025 there are reverse trends of new builds in Ealing. New builds are actually cheaper which bucks the national trend of them having a premium. I predicted that this was due to the number of new builds being built in London being flats and decided to check. It turns out there are very few new builds in Ealing that aren’t flats (approximatly 96% are flats!)
4. Conclusions
Based on Countrywide Dashboard, moving from Ealing to Bath appears to be an option and one that could be advantageous:
- Property prices are cheaper in Bath as the house prices are significantly lower than in Ealing. This means there is the potential for a lessened mortgage cost and upfront cost.
- It is worth noting that Bath is expensive compared to the rest of the country so this argument can be made of Bath to many other locations countrywide.
- Rental prices are more affordable in Bath than Ealing so this could be an option.
- Although London salaries are higher, disposable income is likely to be more in Bath, especially in the case that someone can work remotely or is willing to travel and commute to London.
There are many other factors that are required to consider with a move to a new location; work, access to amenities and simply personal preference that will guide the decision, many of which are very personal.
5. Next Steps for Future Analysis
Other analysis that could strengthen this analysis would be:
- Comparing salary to location averages which would allow a true test of the affordability of the two areas.
- Further to this, the cost of commuting and its feasability.
- A deeper dive into Bath and Ealing to identify which areas are high value and which are affordable. I took a look at this in House Dashboard
- Introduce boxplots and more metrics to do with the spread of the data, such as standard distributions.
- Most of the analysis is from headline figures such as medians, means and ratios. This can be expanded on to give a greater context through distributions.
6. Challenges & Lessons Learned
- Dataset size required early aggregation in SQL. I had to take weighted averages from this. It was a reasonable thing to do, however, the medians are no longer the true medians. It could have been better to reduce the dataset into just the two regions and not aggregating the data.
- Creating comparative regions and towns meant UI limitations. I was required to either duplicate my dataset to create an A and a B region, or setting parameters to set regions A or B. I went down the parameter route for speed, but it had it’s own drawbacks as Tableau cannot update parameter lists, specifically the town parameters. I had to use additional worksheets with tables, filters and dashboard actions. Using the table meant multiple clicks to something that feels like it should be just one.
Appendix: SQL Code & Links to Data
SQL Query: Inflation index per year & region
## Inflation index per year & region
WITH Inflation AS
(
    SELECT
        YEAR([Date]) AS [Year],
        RegionKey,
        AVG(CAST([Index] AS decimal(18,8))) AS YearlyIndex
    FROM Fact_UKHPI
    WHERE RegionKey IS NOT NULL
    GROUP BY YEAR([Date]), RegionKey
),

## 2021 index per region
Inflation2021 AS
(
    SELECT
        RegionKey,
        YearlyIndex
    FROM Inflation
    WHERE [Year] = 2021 AND RegionKey IS NOT NULL
),

## 3 Median as a window function
BaseDetailed AS
(
    SELECT
        d.[Year],
        f.RegionKey,
        g.ActualTownCity,
        f.PropertyType,
        f.OldNew,
        f.Tenure,
        CAST(g.Latitude  AS DECIMAL(11,8))    AS Latitude,
        CAST(g.Longitude AS DECIMAL(11,8))    AS Longitude,
        CAST(f.Price     AS decimal(18,2))    AS Price,
        PERCENTILE_CONT(0.5) WITHIN GROUP (ORDER BY CAST(f.Price AS decimal(18,2)))
            OVER (PARTITION BY d.[Year], f.RegionKey, g.ActualTownCity,
                             f.PropertyType, f.OldNew, f.Tenure) AS MedPrice
    FROM Fact_PPD f
    LEFT JOIN DimDate     d ON f.DateUI      = d.DateUI
    LEFT JOIN DimLocation l ON f.LocationKey = l.LocationKey
    LEFT JOIN DimGeog     g ON l.GeogKey     = g.GeogKey
),

## Aggregates for mean values
Base AS
(
    SELECT
        [Year],
        RegionKey,
        ActualTownCity,
        PropertyType,
        OldNew,
        Tenure,
        AVG(Latitude)                   AS Latitude,
        AVG(Longitude)                  AS Longitude,
        COUNT_BIG(*)                    AS NumberOfSales,
        SUM(Price)                      AS SumPrice,
        MAX(MedPrice)                   AS MedPrice
    FROM BaseDetailed
    GROUP BY
        [Year],
        RegionKey,
        ActualTownCity,
        PropertyType,
        OldNew,
        Tenure
),

## Inflation adjusted values
WithInflation AS
(
    SELECT
        b.*,
        i.YearlyIndex,
        CAST( CAST(b.SumPrice AS decimal(19,8)) * CAST(j.YearlyIndex AS decimal(19,8))
            / CAST(i.YearlyIndex AS decimal(19,8)) AS decimal(19,2)) AS StandSumPrice,
        CAST(CAST(b.MedPrice AS decimal(19,8))* CAST(j.YearlyIndex AS decimal(19,8))
            / CAST(i.YearlyIndex AS decimal(19,8))  AS decimal(19,2)) AS StandMedPrice

    FROM Base b
    LEFT JOIN Inflation     i ON b.[Year]    = i.[Year]  AND b.RegionKey = i.RegionKey
    LEFT JOIN Inflation2021 j ON b.RegionKey = j.RegionKey
)

## Completed query
SELECT
    [Year],
    RegionKey,
    ActualTownCity,
    OldNew,
    PropertyType,
    Tenure,
    Longitude,
    Latitude,
    NumberOfSales,
    SumPrice,
    StandSumPrice,
    MedPrice,
    StandMedPrice
INTO Fact_PPD_Agg_CountryWide
FROM WithInflation
WHERE RegionKey IS NOT NULL;
GO
[1] The Complete Price Paid Data (PPD): https://www.gov.uk/government/statistical-data-sets/price-paid-data-downloads
[3] RPI Housing Rental Index from 1987: https://www.ons.gov.uk/economy/inflationandpriceindices/timeseries/dobp/mm23
[4] Index of Private Rentals from 2005: https://www.ons.gov.uk/datasets/index-private-housing-rental-prices/editions/time-series/versions/41
[5] Private Rent Summary Statistics April 2021 to March 2022: https://www.ons.gov.uk/peoplepopulationandcommunity/housing/datasets/privaterentalmarketsummarystatisticsinengland
[6] UK HPI File Back from 1995:
Dan Druce 2026