 Dan Druce · Portfolio
1. The Dashboard
Below is an embedded version of the dashboard. You can also access the dashboard here.
2. Project Overview
This project was created to demonstrate skills for the Lloyds Data Analyst role, including Big Query, ELT and business facing dashboards in Looker Studio for non technical staff.
The dashboard was made to:
- Provide an overview of general sales performance.
- Analyse product, geography and customer demographics of all companies and specific brands.
- Allow long term and short term analysis to user specified date ranges.
3. Ecommerce Data
This project is a demonstration of an end to end analytics pipeline built on Google Cloud Platform:
Data Source: Big Query public ecommerce dataset “the look”
ELT: Data was exported from big query to raw tables in my dataset. SQL transformations followed from raw data to Dim and Fact tables in a star schema.
Dashboard: A view was made for data analysis in Looker Studio.
It is worth noting that I partitioned the Fact table to improve performance. I typically would have added an index in SQL Server, however this is the BigQuery replacement.
3.1 Fact_Sales Table
## Fact_Sales
CREATE OR REPLACE TABLE `the-look-ecommerce-484919.the_look_d.Fact_Sales` PARTITION BY date_key AS
SELECT
  order_id AS Order_ID,
  user_id AS customer_key,        ## Foreign Key
  product_id AS product_key,      ## Foreign Key
  DATE(created_at) AS date_key,   ## Foreign Key
  status AS order_status,
  sale_price
FROM `the_look_d.order_items`;

## The Primary Key is a composite of order_ID & product_key.
3.2 Dim_Date Table
## Dim_Date Table
CREATE OR REPLACE TABLE `the_look_d.Dim_Date` AS
SELECT
  DISTINCT
    DATE(created_at) AS date_key,              ## Primary Key
    EXTRACT(Year FROM created_at) AS YEAR,
    EXTRACT(Month FROM created_at) AS MONTH,
    EXTRACT(DAY FROM created_at) AS day,
    EXTRACT(DAYOFWEEK FROM created_at) AS day_of_week,
    FORMAT_DATE('%B',DATE(created_at)) AS month_name,
    FORMAT_DATE('%D',DATE(created_at)) AS day_name
FROM `the_look_d.order_items`
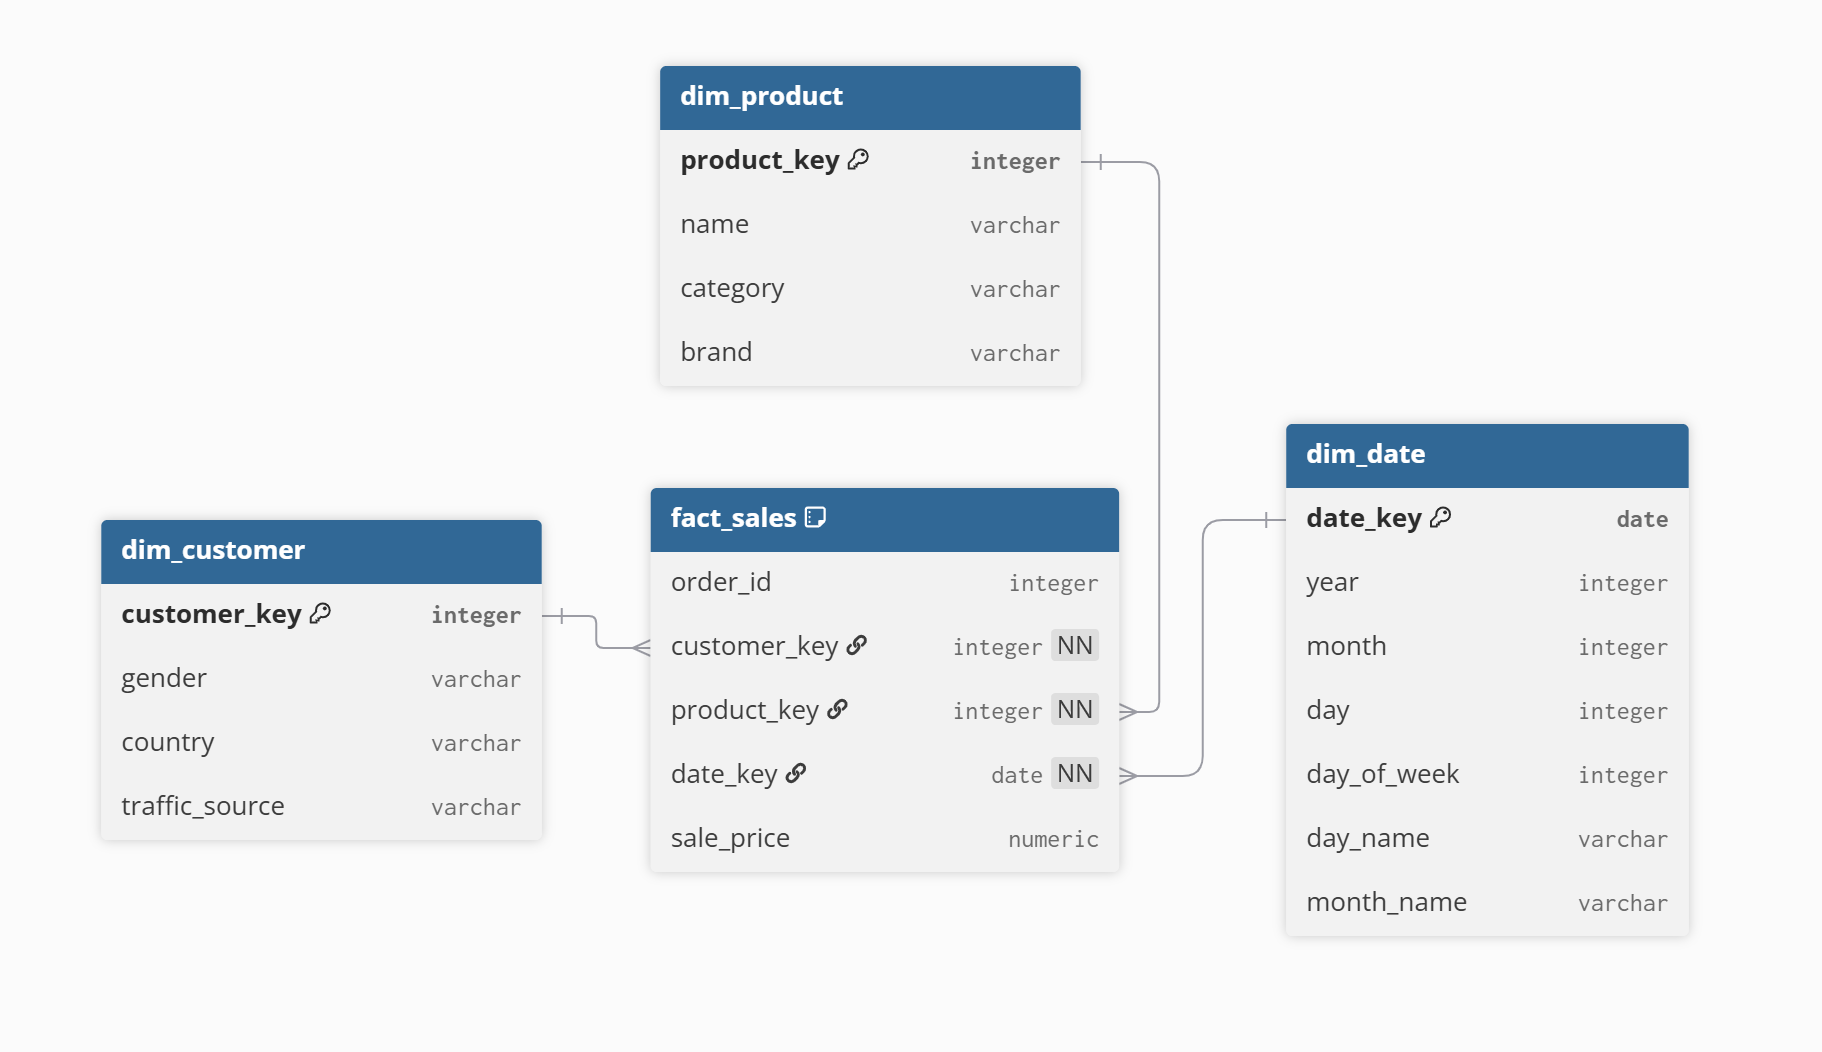
3.3 Data Structure - Star Schema
Here is my database diagram using dbdiagram.io:
3.4 Sales Dashboard Data - View used in Looker
## View
CREATE VIEW `the-look-ecommerce-484919.the_look_d.Vw_sales_dashboard` AS
SELECT
  d.Date_key,
  d.Dim_Year,
  d.Dim_Month,
  d.month_name,
  f.order_status,
  p.category,
  p.department,
  p.brand,
  c.gender,
  c.country,
  c.age,
  c.traffic_source,
  f.sale_price,
  p.retail_price,
  p.cost,

FROM `the-look-ecommerce-484919.the_look_d.Fact_Sales` f
INNER JOIN `the_look_d.Dim_Date` d ON f.date_key = d.date_key
INNER JOIN `the_look_d.Dim_Products` p ON f.Product_key = p.product_key
INNER JOIN `the_look_d.Dim_Customers` c ON f.customer_key = c.customer_key
4. Project Specific Notes
- Used ELT to ensure that all data processing happens within BigQuery meaning the pipeline is simple and uses BigQuery’s performance efficiency.
- Structured the data using a star schema, making queries easy to write and understand.
- Added filters to the dashboard to allow users to explore the data.
- The long term trends chart’s date range is always fixed and doesn’t change with the user added date filters, ensuring users always have long term context.
5. Next Steps for Future Analysis
This project was delivered iteratively in an agile style, focusing on a clear data model followed by an easy to use dashboard. Given more time, the project can be developed in these ways to add further value:
- Product sale_price and retail_price could be combined using SQL case logic to classify items as full price or discounted. This would allow pricing analysis.
- Combining Sale_price and (product) cost would allow profit margin to be tracked over time rather than just revenue.
- The traffic_course column showed how customers arrived at the site. Incorporating this in the dashboard would allow the user to identify which channels drove the most traffic or revenue.
- To improve speed of the dashboard I could reduce the scope of the filters. This could be easily done with a where statement within the view and could restrict the data, for instance, orders with a status of complete. I could also introduce clustering of my partition to the frequently used join keys.
- BigQuery scheduled queries could be used to automate the refresh of the data.
Dan Druce 2026