School Dashboard
Overview
I have used Power BI for this project. As my current workplace does not allow Power BI to publish to the web, I cannot share the dashboard directly. For this reason I have taken screenshots.
I created three dashboards: Attendance & Punctuality, Academic Grades, and SEN. The screenshots below are taken from dummy data I generated to replicate real school analysis while keeping all data entirely fictional.
The Dataset
I created a school dataset with attendance data and GCSE grade data. This is effectively a small subset of the data I would analyse in schools and enough to showcase some of what I made. I took the effort to make a new dataset as all the analysis I did previously is private. The data is generated using Python and formulas to replicate some randomness. The dataset is comprised of 5 year groups, each of 100 students, containing their attendance data and GCSE results after 5 years at the fictional school. I also created some fake special educational needs data (SEN). The 500 names were generated from an AI chatbot.
The tables I created with generated data follow this form:
- DimPupils
- DimSEN
- DimSchoolCalendar
- FactAttendance
- FactGCSEGrades
Software: I used MS SQL Server as my database and SSMS to manipulate it. I created a local database and uploaded CSV files with the required information. This differed from my live connections at my previous school but sufficed for exhibition purposes.
Data Manipulation
I created many views in SSMS and imported these to Power BI. I deliberately entered the GCSE grades as a wide table into my database as I wanted to practise unpivoting this in SQL to create the FactGCSEGrades table. This is something I did frequently in my data role — most Excel tables were not originally stored in a school database and were structured this way in Excel.
When I had tall tables most manipulation was done in SQL. I did, however, make some calculated columns and measures which are used within the sheets:
Power BI Calculated Fields and Measures
-- Calculated Column for Grade Banding
Banding = IF(GradesMidyisResid[Grade]<4,"1-3",
          IF(GradesMidyisResid[Grade]<7,"4-6", "7-9"))

-- Measure for Percentage Present
% Present = DIVIDE(
  COUNTROWS(FILTER(AttendanceData,
    AttendanceData[txtRegistrationStatus]="Present")),
  COUNTROWS(FILTER(AttendanceData,
    AttendanceData[txtRegistrationStatus] IN {"Present","Absent"}))
)
The banding column was used to group students into poor, good, and excellent grade bands — used extensively in the SEN Dashboard. The % Present measure calculates the proportion of attended days out of all possible school days.
Attendance & Punctuality Dashboard
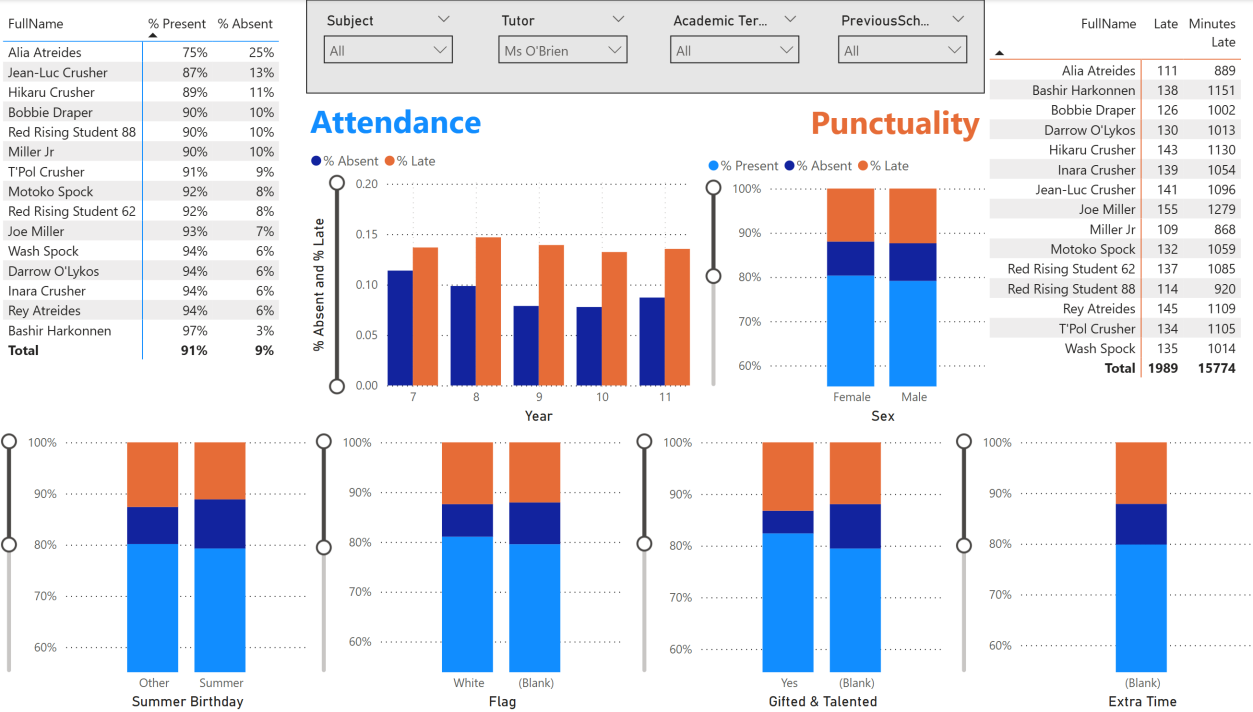
This dashboard was designed for two audiences: a tutor monitoring their tutees on a small group level, and the SEN department reviewing attendance patterns across the whole school. Tutors could follow up on termly attendance, reward punctual students, and set goals for those who struggled. The SEN department would identify students needing interventions.
Interpretation from a Tutor
A good example of a tutor group with variation is Ms O'Brien's. Most of her students from years 9 to 11 had good attendance and punctuality. Alia and Jean-Luc had poor attendance, visible in the spike in the year bar chart.
Interpretation from the SEN Department
On the whole, attendance and punctuality was broadly similar across all educational needs categories. There appeared to be small trends that students without a flag, a white flag, or with 50% extra time had worse attendance; however, the 50% extra time group was only 12 students. The red and yellow flag groups were similarly small, so no finding was statistically significant. Attendance was best in the first and last year of students.
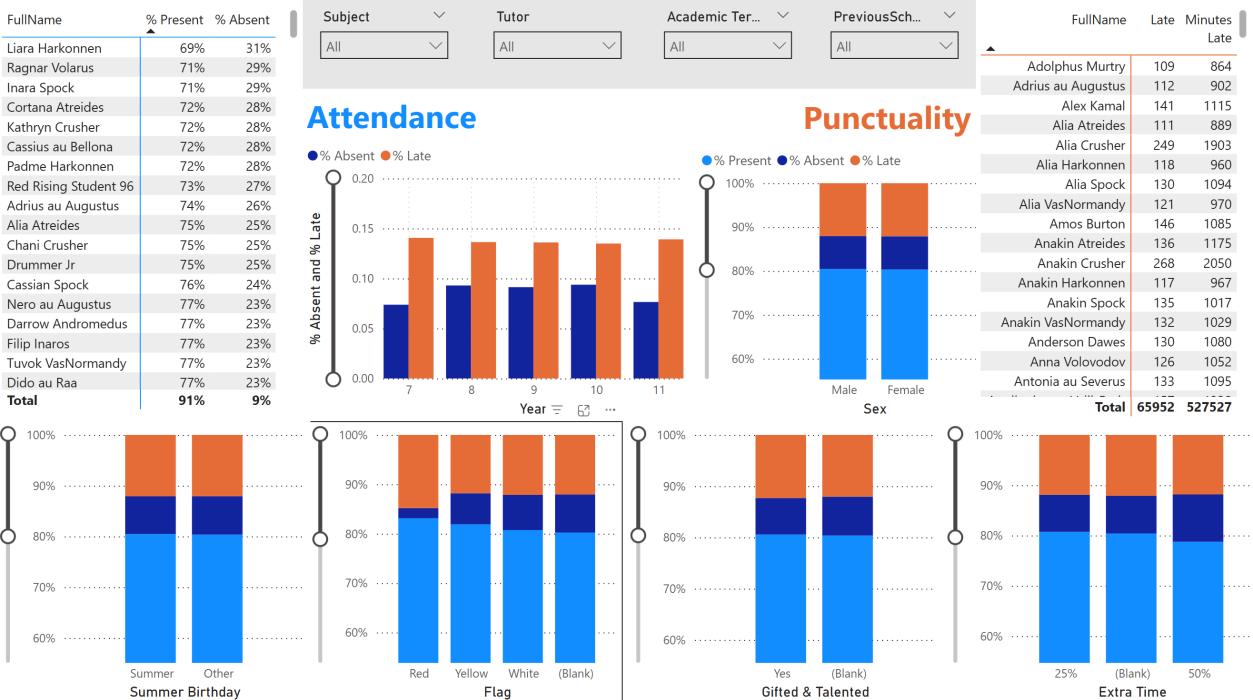
General Observations
Both punctuality and attendance were observed to be poor in my dataset. Even the most punctual student was late 80 times out of 960 days, clocking up 641 minutes. If I had not known how the dataset was made, I would be talking to the attendance officer to ensure data was being collected correctly, as it suggests the school has a real problem with both metrics.
Poor data quality was initially a common problem at my previous school. A lot of data was collected either incorrectly or to a mixed, inconsistent standard. Much of my early work was training teachers and support staff on how to correctly input and maintain their datasets.
Year 11 and Year 7 did have slightly better attendance than the other years. The attendance data was ultimately too random — the random function meant there was no strong pattern. I subsequently updated the attendance data to make it more realistic, but did not alter punctuality due to time constraints.
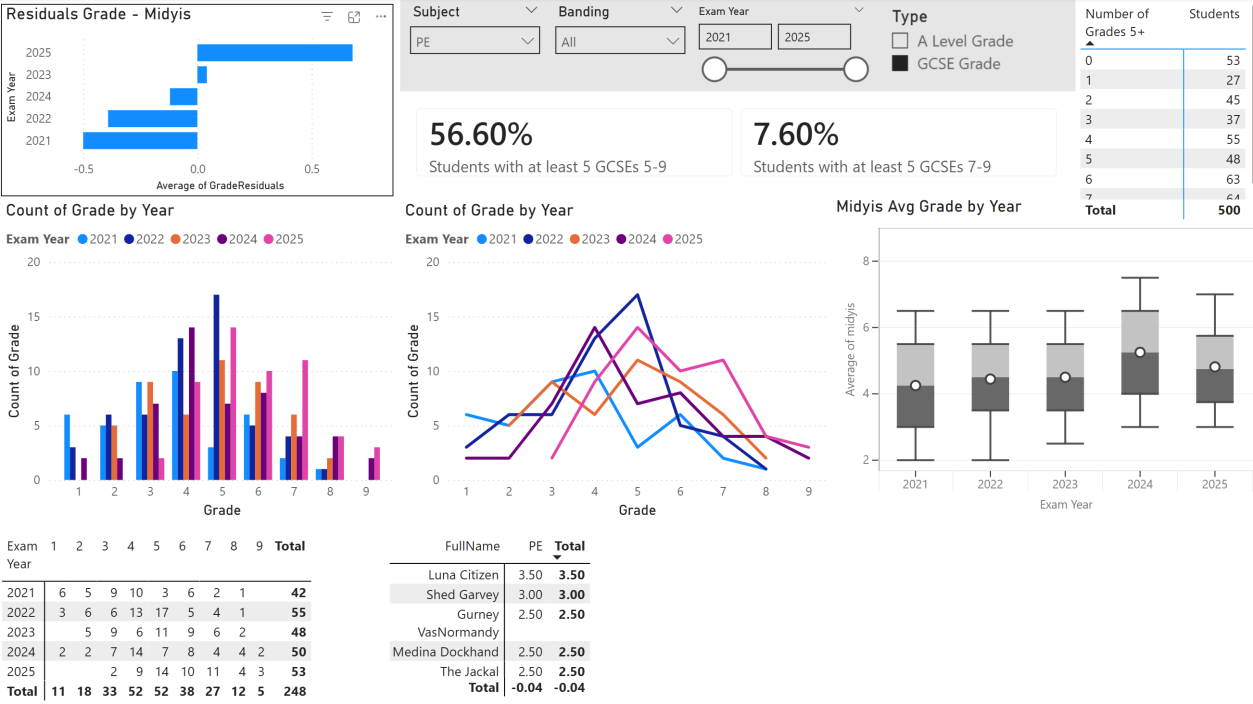
Academic Grades Dashboard
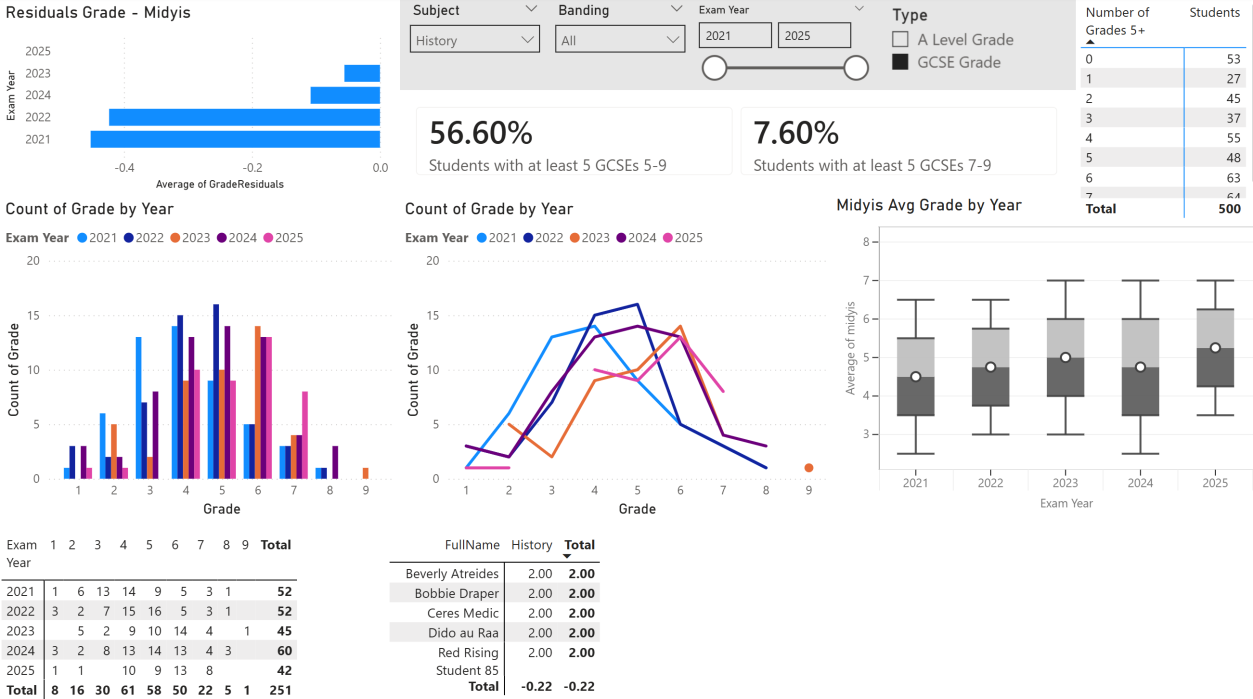
The GCSE grades dashboard is a collection of tools used to identify patterns in the data, accumulated on one page. It is a generalist dashboard not designed for one specific user. Key components include:
- Grade–Midyis residual: subtracts a predictive baseline test (Midyis) from the actual grade to show over- or underperformance
- Count of GCSEs displayed in a bar chart, table, and frequency polygon
- Cards counting students with at least 5 GCSEs at grades 5–9 and 7–9 (these were metrics commonly used in our school)
- Individual student performance table for SLT review
- Midyis average plotted on a boxplot to identify stronger cohorts on entry
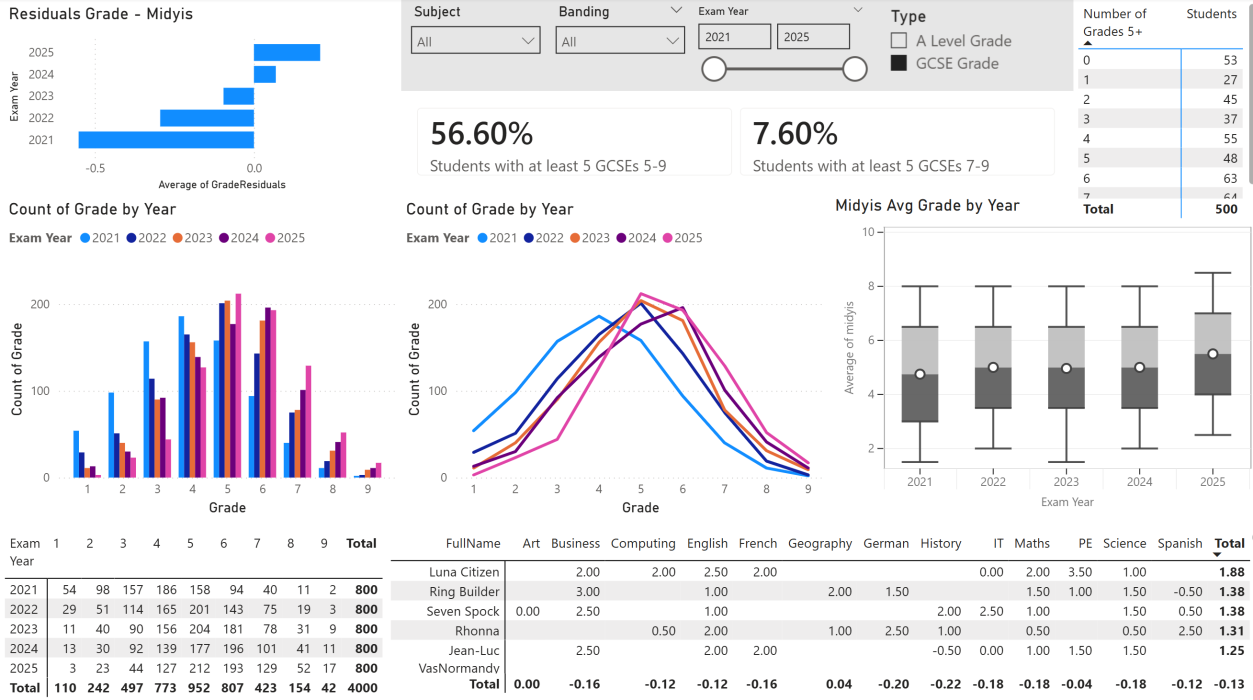
Grade Distributions
It is clear from the frequency polygons that those examined in 2021 were the weakest GCSE year and 2025 the strongest. This pattern was also seen in the baseline data, but 2021 also underperformed most on their residuals — meaning these students started the weakest and made the least progress towards their predicted Midyis grade.
Banding Trend
When looking at the residual grade with the banding filter, there were clear differences between groups:
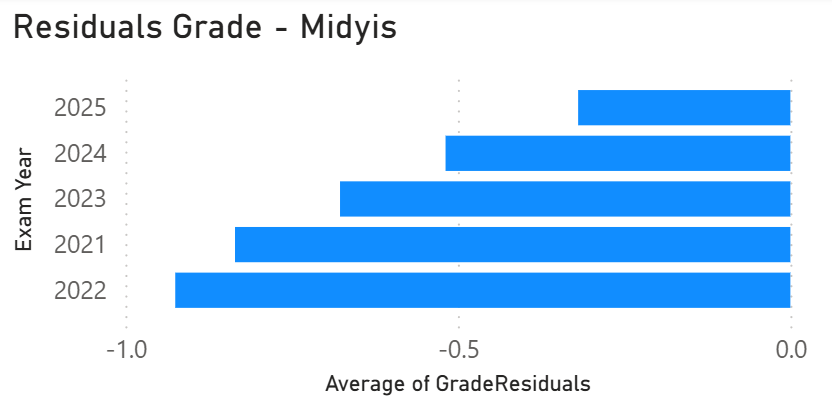
Banding 1–3: Underperformed in every year recorded.
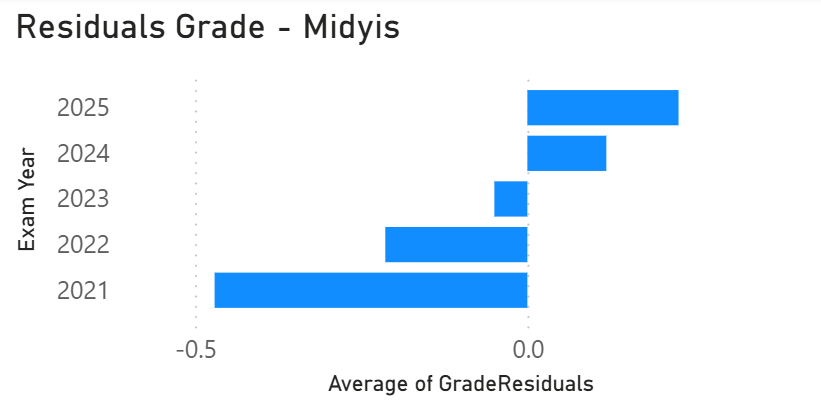
Banding 4–6: Mixed results, with some recent improvement.
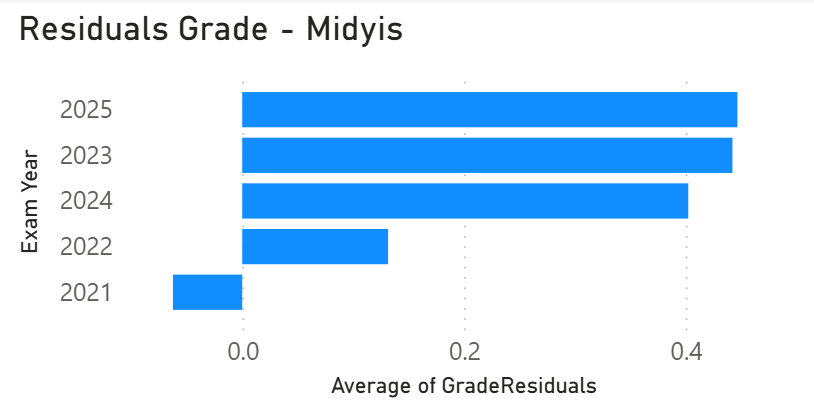
Banding 7–9: Positive residuals in most years, particularly strong in 2025.
The school appears to have a problem supporting students with a weaker Midyis baseline. The lowest band (1–3) underperformed in every year recorded. I would strongly recommend that the school targets lower band students for two reasons:
- These are the students most at risk of failing their GCSEs. Anything below a grade 4 is classed as a failure, and the school's core goal is to prevent this wherever possible.
- These students are the ones most underperforming relative to their baseline. They have predicted grades that suggest they are capable of more, making targeted intervention both warranted and potentially impactful.
SEN Dashboard
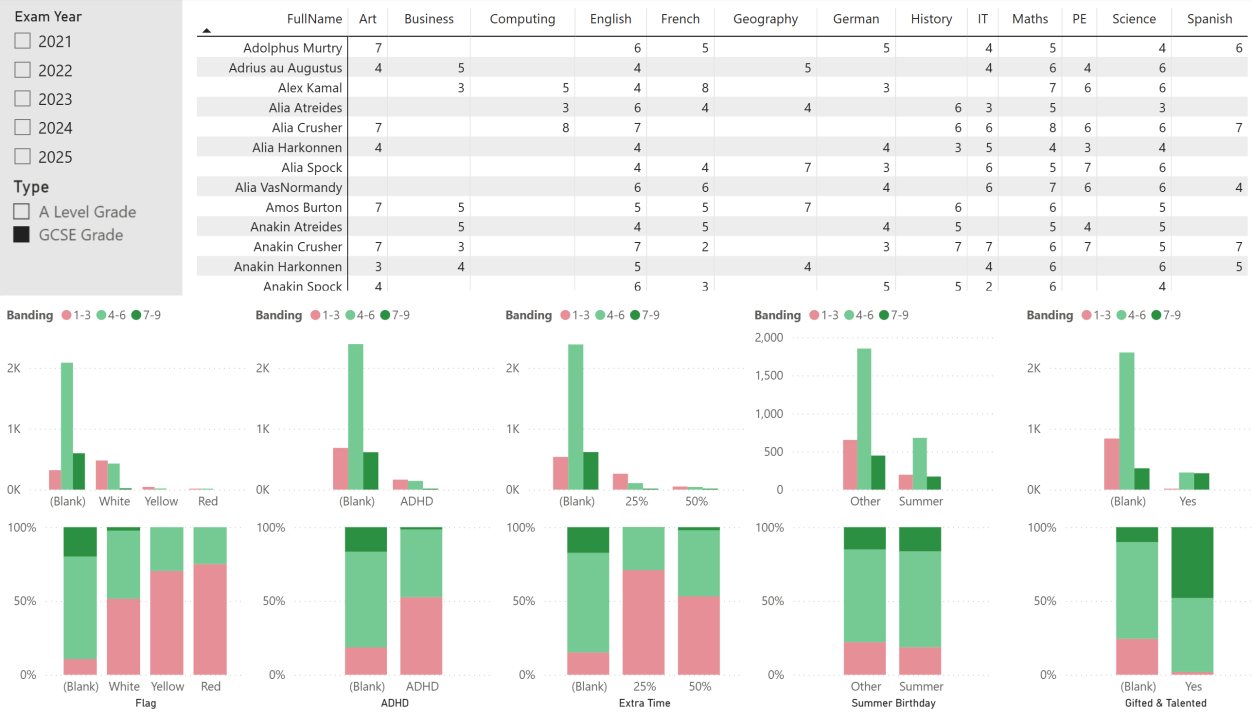
Students Based on Descriptors
Students deemed "gifted and talented" are exceeding at GCSE — they make up a large proportion of the top band. Students with a SEN flag, extra time, or ADHD did not attain these top bands in large numbers; proportionally very few did. Of just under 900 grades associated with a white SEN flag, over 50% did not attain a pass. This is a large group of students and worth targeting.
Individual Students
It was clear that Luna Citizen made the most progress according to residuals by quite a margin. Most students with the lowest negative residuals were in year 7, with Inara, Jyn, Anakin, and Bashir within the bottom five.
Subject Analysis
The SEN Dashboard can infer which subjects are performing well and which are struggling. History struggled across all years — on average it never added to the baseline in any year and failed frequently to achieve higher grades despite having some successful individual students.
PE, by contrast, did exceptionally well in 2025 — with only 2 of 53 grades being a failure. The residuals equate to adding 0.68 of a grade above the baseline prediction. Looking at the frequency polygon, results are shifted significantly to the right compared to previous years, meeting or exceeding all years from grades 6 to 9.
Other Dashboards
Some of the dashboards above are a mix of a few good things that I made at school. Useful dashboard pages I built at my previous school that are not included here are:
- Attendance vs grades
- Boys vs girls comparison
- Subject comparison of overall grades
- Feeder school impact on final grade
- Progress 8 (a metric used by state schools)
- Baseline comparison — multiple baseline tests were given, with a deep analysis of student performance and banding created
- Progress using reporting grades